End-to-End Data Analysis
DS Toolkit is a Decision Science and Advanced Data Analysis tool using cutting edge AI technologies, carefully designed to meet the evolving needs of small and medium enterprises. Explore your business data at a new level with advanced data analytic tools.
Transform your business intelligence with sophisticated analytics that automates key metric calculations, delivers real-time insights, and generates dynamic visualizations. With just a few clicks, you gain access to detailed analytic reports and decision science world tailored to the specific needs of your business.
ü Easy data load:
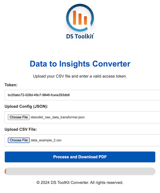
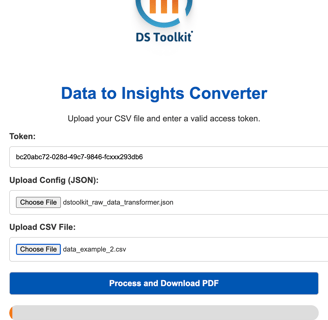
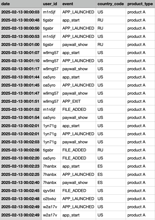
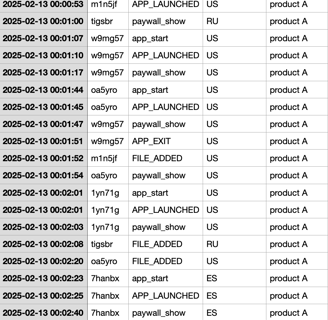
WEB interface: using csv, txt, xlsx, json, parquet
API call: for files transfer, SQL queries
Python library
ü Automated metric calculation: Metrics list and logic tailored to each client’s unique needs.
ü Creating Analytic reports and conclusions
ü Analysis visualization: Export results as PDF or integrate directly into BI tools.
Making Data Analytics Accessible and Effective!
Data Analysis with DS Toolkit
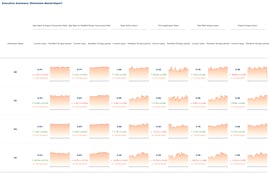
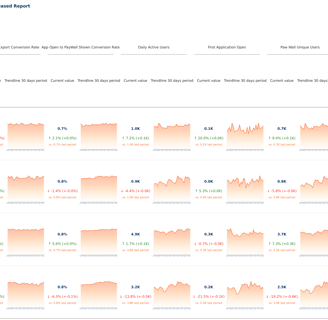
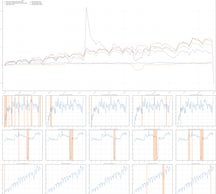
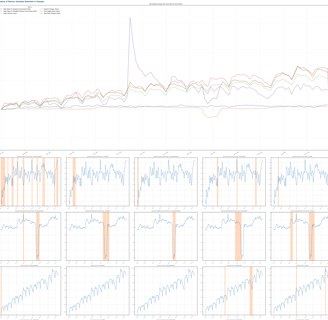
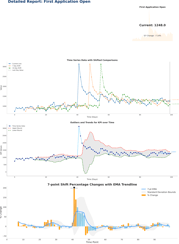
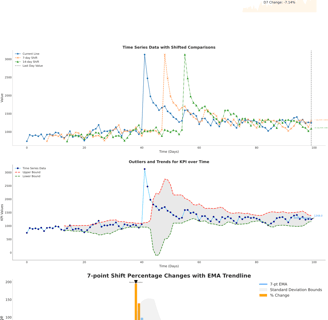
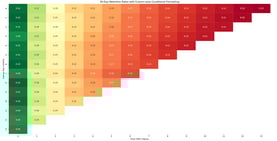
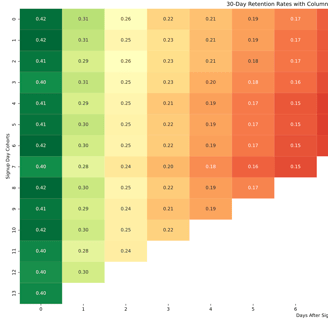
Deep Trend Analysis: The system performs a comprehensive analysis of data, identifying both short-term fluctuations and long-term trends in your data. This not only helps in understanding current dynamics but also in building accurate predictive models for planning future business performance. The algorithms take into account seasonality, market cycles, and external factors affecting your business processes.
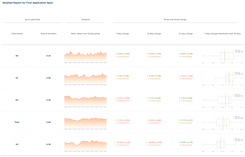
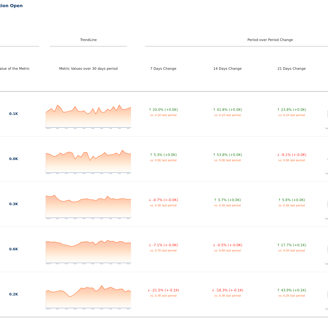
Track Key Metrics: The platform ensures continuous monitoring of key business indicators. It tracks deviations from the norm, provides clear visualizations, and offers detailed analytics for each metric. This enables timely responses to any changes in business processes and the ability to make prompt managerial decisions.
Deep Trend Analysis: The system performs a comprehensive analysis of data, identifying both short-term fluctuations and long-term trends in your data. This not only helps in understanding current dynamics but also in building accurate predictive models for planning future business performance. The algorithms take into account seasonality, market cycles, and external factors affecting your business processes.
Track Key Metrics: The platform ensures continuous monitoring of key business indicators. It tracks deviations from the norm, provides clear visualizations, and offers detailed analytics for each metric. This enables timely responses to any changes in business processes and the ability to make prompt managerial decisions.